Market Outlook
December 29, 2017
Market Cues
Domestic Indices
Chg (%)
(Pts)
(Close)
Indian markets are likely to open flat tracking global indices and SGX Nifty.
BSE Sensex
(0.2)
(64)
33,848
US stocks were little changed on Thursday and Dow logged its 71st record close in
Nifty
(0.1)
(13)
10,478
2017, buoyed mostly by gains in bank shares and a slight pickup in energy and
Mid Cap
0.1
18
17,692
materials, as crude-oil prices perked up in seasonally light trading volume. The Dow
Small Cap
0.3
61
19,109
climbed 0.3% to finish at 24,837, the NASDAQ edged up 0.2% to close at 6,950
Bankex
(0.3)
(78)
28,754
and the S&P 500 rose 0.2% to end at 2,687
U.K. market is slightly up, as mining stocks continue to attract attention, buoyed by
Global Indices
Chg (%)
(Pts)
(Close)
rising commodity prices. The FTSE 100 is down by 0.01% to close at 7,623.
Dow Jones
0.3
63
24,838
Nasdaq
0.2
11
6,950
On domestic from, Indices remained flat but at end of the session market corrected.
FTSE
0.0
2
7,623
Primarily owing to expiry of December derivatives contracts and on fears that the
government going for additional borrowing could upset fiscal deficit calculations.
Nikkei
0.2
56
22,840
Moreover rally in crude also kept market under pressure. The Sensex ended down
Hang Seng
0.3
81
29,945
0.19% at 33,848.The Nifty ended at 10,478, recording a loss of 0.12%.
Shanghai Com
0.0
0
3,297
News Analysis
Advances / Declines
BSE
NSE
Jio to buy RCom's mobile biz
Advances
1,448
911
Detailed analysis on Pg2
Declines
1,338
856
Unchanged
190
51
Investor’s Ready Reckoner
Key Domestic & Global Indicators
Volumes (` Cr)
Stock Watch: Latest investment recommendations on 150+ stocks
Refer Pg5 onwards
BSE
4,747
NSE
40,832
Top Picks
CMP
Target
Upside
Company
Sector
Rating
(`)
(`)
(%)
Net Inflows (` Cr)
Net
Mtd
Ytd
Blue Star
Capital Goods Accumulate
814
867
6.5
FII
1,254
(6,579)
51,053
Dewan Housing Finance
Financials
Buy
586
712
21.6
*MFs
1,012
6,114 1,16,352
Asian Granito
Other
Accumulate
558
597
6.9
Navkar Corporation
Other
Buy
190
265
39.5
Top Gainers
Price (`)
Chg (%)
KEI Industries
Capital Goods
Buy
362
436
20.4
More Top Picks on Pg4
Unitech
8
11.0
Relcapital
571
9.7
Key Upcoming Events
Jpassociat
23
8.7
Previous
Consensus
Date
Region
Event Description
Reading
Expectations
Rcom
31
7.7
Dec31
Germany PMI Manufacturing
63.30
63.30
Hindcopper
103
6.6
Jan02
China
PMI Manufacturing
51.80
51.60
Jan02
UK
PMI Manufacturing
58.20
57.90
Top Losers
Price (`)
Chg (%)
Jan03
US
Change in Nonfarm payrolls
228.00
188.00
Jan04
Germany
Unemployment change (000's)
(18.00)
(13.00)
Rtnpower
8
(4.5)
More Events on Pg7
Balramchin
131
(2.9)
Canfinhome
476
(2.9)
Bajajhldng
2,879
(2.7)
Bomdyeing
277
(2.6)
As on December 28 2017
Market Outlook
December 29, 2017
News Analysis
Jio to buy RCom's mobile biz
Mukesh Ambani’s Reliance Jio Infocomm Ltd. agreed to buy spectrum, towers and
other wireless infrastructure of his younger brother Anil Ambani’s Reliance
Communications Ltd. that’s selling assets (an astimated price of
`20000cr-
24000cr) to repay lenders.
Post RCom defaulted on loans payment it entered the Strategic Debt Restructuring
(SDR) scheme to recast its debt worth `44,700cr inQ4FY17.Since them news of
selling telecom business begun.
The transaction will close in a phased manner in the first quarter of calendar year
2018 and the proceeds will be used entirely for debt reduction. Currently RCOM
balance sheet has debt of `45000cr, management has assured that company will
reduce debt by `40000cr by selling Telecom business and real estate business.
Jio, will acquire a)122.4 MHz of 4G spectrum in the 800/900/1800/2100 MHz
bands b) over 43,000 towers c) around 178,000 route km of fibre with a pan-
Indian footprint and d) 248 media convergence nodes, e) covering 5 million sq ft
used for hosting telecom infrastructure.
Economic and Political News
Govt may exceed `10 lakh cr farm credit target once again
Insolvency Bill eases rules for SME promoters
NITI Aayog working on policy to cut oil bill by $100 bn by 2030
Corporate News
Lupin receives USFDA approval for generic Dovonex Scalp Solution.
Quess Corp to acquire additional 10% stake in Golden Star Facilities and
services for Rs 5 crore.
Centrum Capital to consider fundraising through securities on Jan. 3.
Market Outlook
December 29, 2017
Top Picks HHHHH
Market Cap
CMP
Target
Upside
Company
Rationale
(` Cr)
(`)
(`)
(%)
Strong growth in domestic business due to its leade`hip
in acute therapeutic segment. Alkem expects to launch
Alkem Laboratories
26,136
2,186
2,341
7.1
more products in USA, which bodes for its international
business.
We expect the company would report strong profitability
Asian Granito
1,680
558
597
6.9
owing to better product mix, higher B2C sales and
amalgamation synergy.
Favorable outlook for the AC industry to augur well for
Cooling products business which is out pacing the
Blue Star
7,807
814
867
6.5
market growth. EMPPAC division's profitability to
improve once operating environment turns around.
With a focus on the low and medium income (LMI)
consumer segment, the company has increased its
Dewan Housing Finance
18,368
586
712
21.6
presence in tier-II & III cities where the growth
opportunity is immense.
Loan growth is likely to pick up after a sluggish FY17.
Lower credit cost will help in strong bottom-line growth.
Karur Vysya Bank
8,909
123
180
45.8
Increasing share of CASA will help in NIM
improvement.
High order book execution in EPC segment, rising B2C
KEI Industries
2,837
362
436
20.4
sales and higher exports to boost the revenues and
profitability
Expected to benefit from the lower capex requirement
Music Broadcast
2,197
385
434
12.7
and 15 year long radio broadcast licensing.
Massive capacity expansion along with rail advantage
Navkar Corporation
2,860
190
265
39.5
at ICD as well CFS augur well for the company
Strong brands and distribution network would boost
Siyaram Silk Mills
3,542
756
813
7.6
growth going ahead. Stock currently trades at an
inexpensive valuation.
Market leadership in Hindi news genre and no.
2
viewership ranking in English news genre, exit from the
TV Today Network
2,596
435
500
14.9
radio business, and anticipated growth in ad spends by
corporate to benefit the stock.
After GST, the company is expected to see higher
volumes along with improving product mix. The Gujarat
Maruti Suzuki
2,90,918
9,631
10,619
10.3
plant will also enable higher operating leverage which
will be margin accretive.
We expect loan book to grow at 24.3% over next two
GIC Housing
2,516
467
655
40.2
year; change in borrowing mix will help in NIM
improvement
We expect CPIL to report net Revenue/PAT CAGR of
~17%/16% over FY2017-20E mainly due to healthy
7,502
338
400
18.5
growth in plywood & lamination business, forayed into
Century Plyboards India
MDF & Particle boards on back of strong brand &
distribution network.
We expect sales/PAT to grow at 13.5%/20% over next
LT Foods
2,850
89
96
7.7
two years on the back of strong distribution network &
addition of new products in portfolio.
We expect sales/PAT to grow at 13%/16% over next two
years on the back of strong healthy demand in writing
Ruchira Papers
444
198
244
23.2
& printing paper and Kraft paper. Further, China had
banned making paper from waste pulp which would
benefit Indian paper companies.
Source: Company, Angel Research
Market Outlook
December 29, 2017
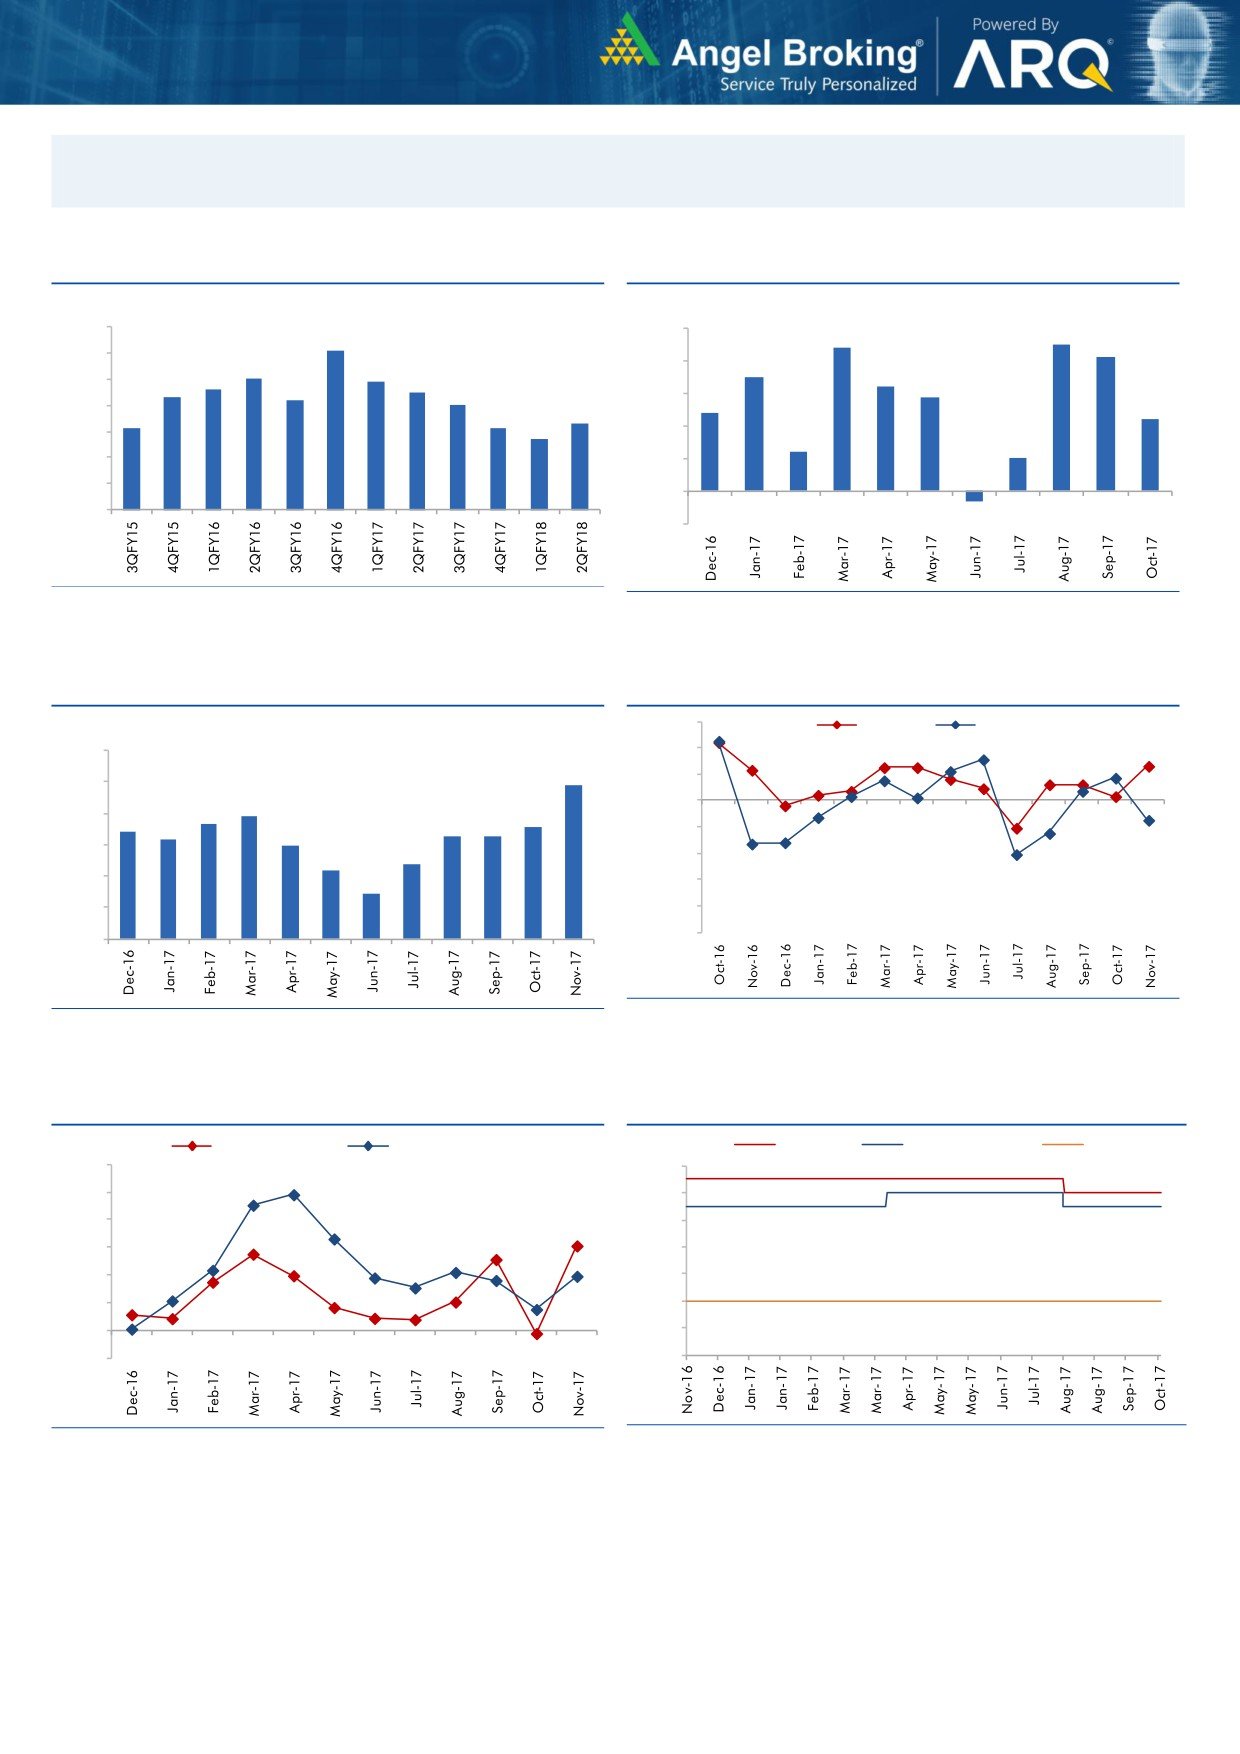
Macro watch
Exhibit 1: Quarterly GDP trends
Exhibit 2: IIP trends
(%)
(%)
10.0
5.0
4.5
9.1
4.4
4.1
9.0
8.0
7.9
4.0
3.5
7.6
7.5
3.2
8.0
7.3
7.2
2.9
7.0
3.0
2.4
7.0
6.3
2.2
6.1
6.1
5.7
2.0
6.0
1.2
1.0
5.0
1.0
4.0
-
3.0
(1.0)
(0.3)
Source: CSO, Angel Research
Source: MOSPI, Angel Research
Exhibit 3: Monthly CPI inflation trends
Exhibit 4: Manufacturing and services PMI
56.0
Mfg. PMI
Services PMI
(%)
6.0
54.0
4.9
52.0
5.0
3.9
50.0
4.0
3.7
3.6
3.4
3.3
3.3
3.2
3.0
48.0
3.0
2.4
2.2
46.0
2.0
1.5
44.0
1.0
42.0
40.0
-
Source: Market, Angel Research; Note: Level above 50 indicates expansion
Source: MOSPI, Angel Research
Exhibit 5: Exports and imports growth trends
Exhibit 6: Key policy rates
(%)
Exports yoy growth
Imports yoy growth
(%)
Repo rate
Reverse Repo rate
CRR
60.0
6.50
50.0
6.00
40.0
5.50
30.0
5.00
20.0
4.50
10.0
4.00
0.0
3.50
(10.0)
3.00
Source: Bloomberg, Angel Research
Source: RBI, Angel Research
Market Outlook
December 29, 2017
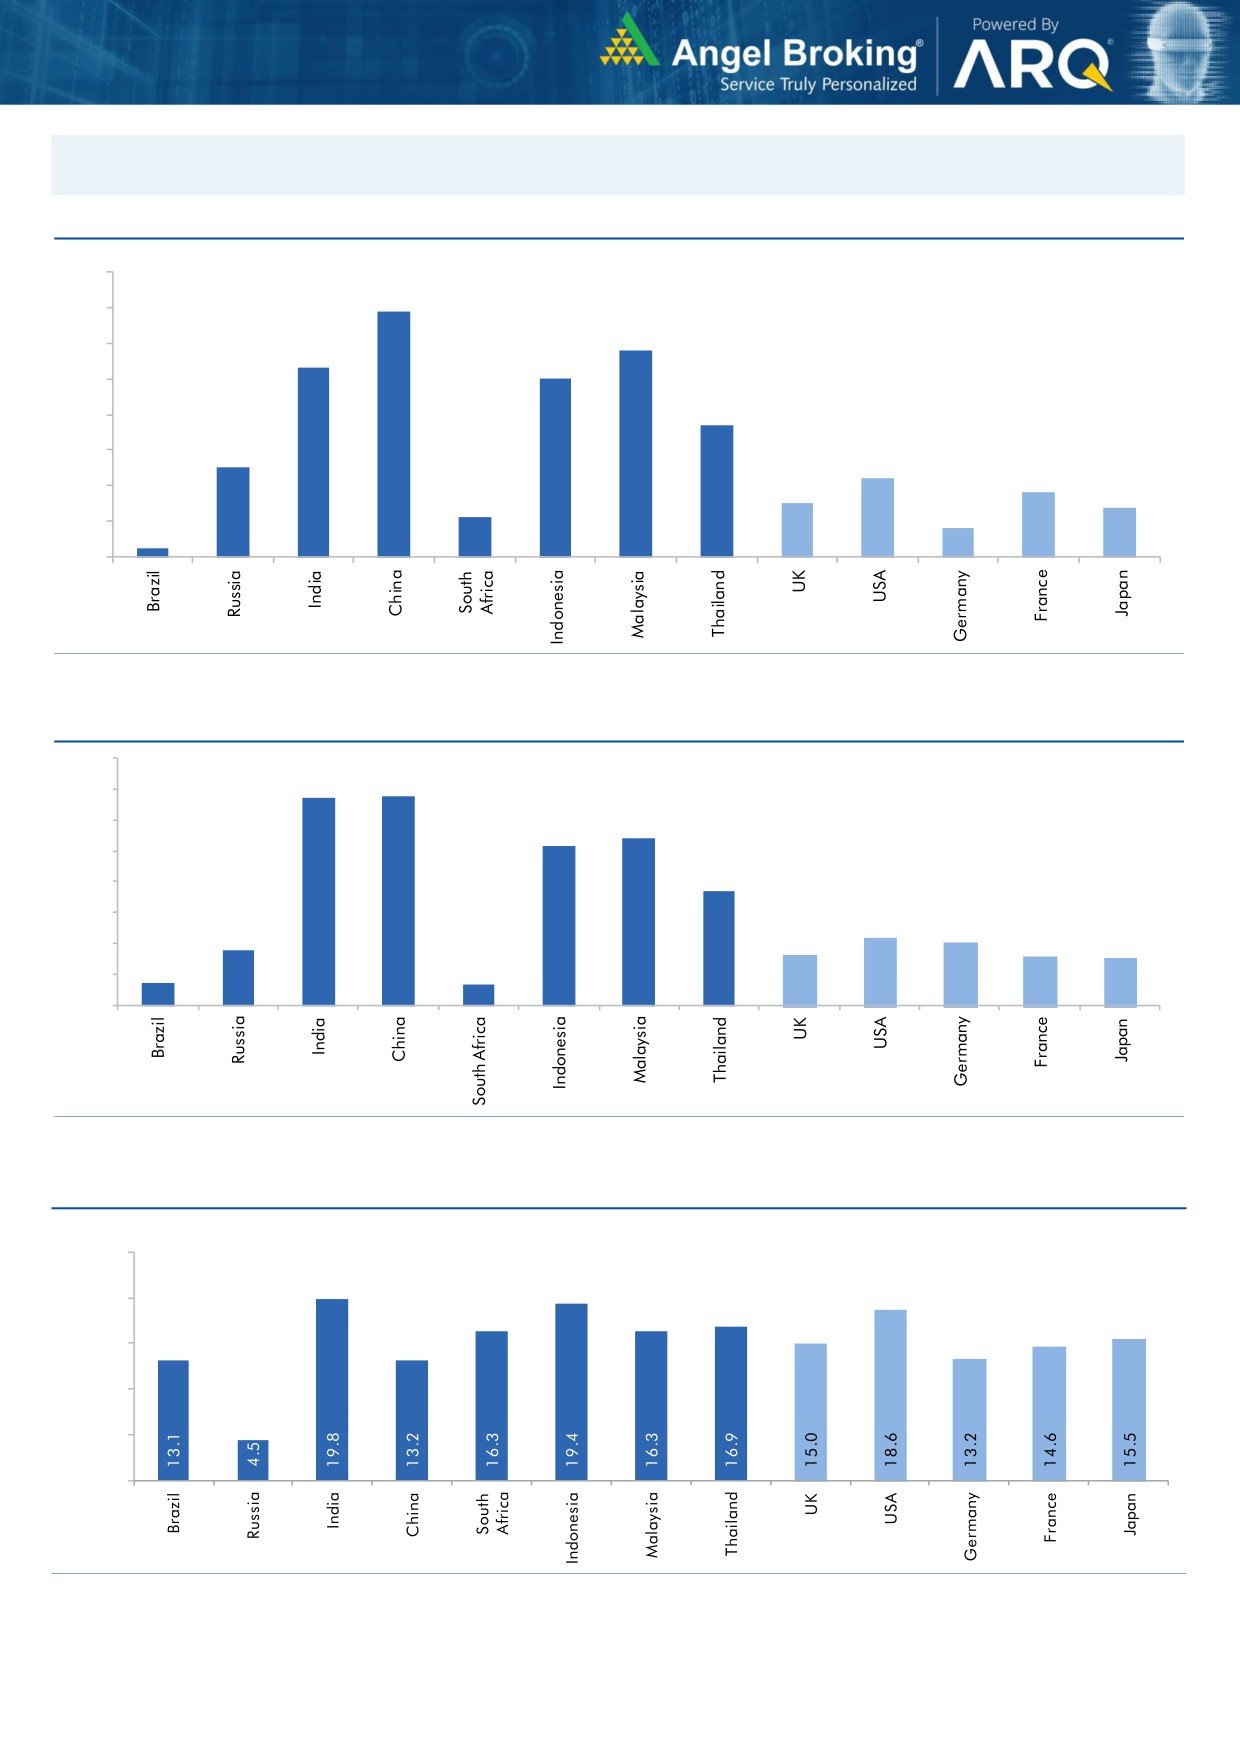
Global watch
Exhibit 1: Latest quarterly GDP Growth (%, yoy) across select developing and developed countries
(%)
8.0
6.9
7.0
5.8
6.0
5.3
5.0
5.0
1.1
3.7
4.0
2.5
3.0
2.2
1.8
2.0
1.5
1.4
0.8
1.0
0.3
-
Source: Bloomberg, Angel Research
Exhibit 2: 2017 GDP Growth projection by IMF (%, yoy) across select developing and developed countries
(%)
6.7
6.8
7.0
6.0
5.4
5.2
5.0
3.7
4.0
3.0
1.8
2.2
2.0
1.7
1.6
2.0
0.7
1.5
0.7
1.0
-
Source: IMF, Angel Research
Exhibit 3: One year forward P-E ratio across select developing and developed countries
(x)
25.0
20.0
15.0
10.0
5.0
-
Source: IMF, Angel Research
Market Outlook
December 29, 2017
Exhibit 4: Relative performance of indices across globe
Returns (%)
Country
Name of index
Closing price
1M
3M
1YR
Brazil
Bovespa
76,402
3.2
1.3
33.4
Russia
Micex
2,103
(2.2)
1.5
(5.8)
India
Nifty
10,478
0.8
6.1
32.5
China
Shanghai Composite
3,296
(1.2)
(1.3)
5.1
South Africa
Top 40
52,071
(3.6)
6.2
21.5
Mexico
Mexbol
48,862
1.9
(3.0)
6.4
Indonesia
LQ45
1,070
6.2
10.9
21.5
Malaysia
KLCI
1,779
3.6
0.8
8.9
Thailand
SET 50
1,129
4.2
6.4
19.6
USA
Dow Jones
24,838
5.3
11.2
25.3
UK
FTSE
7,623
2.9
4.2
6.7
Japan
Nikkei
22,784
1.3
12.1
17.3
Germany
DAX
12,980
(0.6)
3.1
13.1
France
CAC
5,339
(0.9)
1.1
9.0
Source: Bloomberg, Angel Research p68in4
Market Outlook
December 29, 2017
Key Upcoming Events
Global economic events release calendar
Bloomberg Data
Date
Time Country
Event Description
Unit
Period
Last Reported
Estimated
Dec 31, 2017
2:25 PMGermany
PMI Manufacturing
Value
Dec F
63.30
63.30
Jan 02, 2018
6:30 AMChina
PMI Manufacturing
Value
Dec
51.80
51.60
3:00 PMUK
PMI Manufacturing
Value
Dec
58.20
57.90
Jan 03, 2018
7:00 PMUS
Change in Nonfarm payrolls
Thousands
Dec
228.00
188.00
Jan 04, 2018
2:25 PMGermany
Unemployment change (000's)
Thousands
Dec
(18.00)
(13.00)
Jan 05, 2018
2:25 PMGermany
PMI Services
Value
Dec F
55.80
55.80
7:00 PMUS
Unnemployment rate
%
Dec
4.10
4.10
Jan 08, 2018
3:30 PMEuro Zone
Euro-Zone Consumer Confidence
Value
Dec F
0.50
Jan 10, 2018
3:00 PMUK
Industrial Production (YoY)
% Change
Nov
3.60
India
Imports YoY%
% Change
Dec
19.60
India
Exports YoY%
% Change
Dec
30.60
Jan 11, 2018
US
Producer Price Index (mom)
% Change
Dec
1.40
Jan 12, 2018
China
Exports YoY%
% Change
Dec
12.30
7:00 PMUS
Consumer price index (mom)
% Change
Dec
0.40
Jan 15, 2018
12:00 PMIndia
Monthly Wholesale Prices YoY%
% Change
Dec
3.93
Jan 16, 2018
3:30 PMEuro Zone
Euro-Zone CPI (YoY)
%
Dec F
1.50
Jan 17, 2018
3:00 PMUK
CPI (YoY)
% Change
Dec
3.10
7:45 PMUS
Industrial Production
%
Dec
0.20
Jan 18, 2018
7:00 PMUS
Housing Starts
Thousands
Dec
1,297.00
7:00 PMUS
Building permits
Thousands
Dec
1,303.00
Jan 24, 2018
8:30 PMUS
Existing home sales
Million
Dec
5.81
3:00 PMUK
Jobless claims change
% Change
Dec
5.90
Jan 25, 2018
8:30 PMUS
New home sales
Thousands
Dec
733.00
6:15 PMEuro Zone
ECB announces interest rates
%
Jan 25
-
Source: Bloomberg, Angel Research
Stock Watch
December 29, 2017
Company Name
Reco
CMP
Target
Mkt Cap
Sales ( Čcr )
OPM(%)
EPS (Č)
PER(x)
P/BV(x)
RoE(%)
EV/Sales(x)
(Č)
Price ( Č)
( Č cr )
FY18E FY19E
FY18E
FY19E
FY18E
FY19E
FY18E
FY19E
FY18E
FY19E
FY18E
FY19E
FY18E
FY19E
Agri / Agri Chemical
Rallis
Sell
269
209
5,226
1,873
2,099
15.0
15.0
9.5
10.5
28.3
25.6
4.3
3.9
15.8
16.0
2.7
2.4
United Phosphorus
Accumulate
765
820
38,877
18,922
21,949
18.0
18.5
36.2
45.6
21.1
16.8
4.4
3.7
22.7
23.8
2.2
1.9
Auto & Auto Ancillary
Ashok Leyland
Accumulate
118
127
34,467
23,339
27,240
10.1
10.8
4.7
6.2
25.3
18.9
5.1
4.5
20.0
23.6
1.4
1.2
Bajaj Auto
Neutral
3,301
-
95,533
23,936
27,955
19.5
20.1
142.7
167.3
23.1
19.7
5.0
4.5
21.8
22.8
3.6
3.0
Bharat Forge
Buy
731
875
34,025
7,637
8,755
21.7
23.2
36.1
47.3
20.3
15.5
3.6
3.1
18.5
20.8
4.3
3.7
Eicher Motors
Neutral
29,832
-
81,254
19,043
22,837
19.5
19.9
835.4
1,019.0
35.7
29.3
13.3
10.3
40.9
37.8
4.1
3.4
Gabriel India
Neutral
196
-
2,813
1,782
2,033
9.7
10.2
7.1
8.9
27.6
22.1
5.6
4.7
21.0
22.2
1.5
1.3
Hero Motocorp
Accumulate
3,714
4,129
74,161
32,239
36,878
16.0
15.6
184.4
206.5
20.1
18.0
6.3
5.5
31.3
30.7
2.1
1.8
Jamna Auto Industries Neutral
81
-
3,230
1,441
1,662
14.4
14.8
13.9
17.6
5.8
4.6
1.6
1.3
30.0
31.0
2.2
1.9
Mahindra and Mahindra Neutral
750
-
93,277
46,971
53,816
13.6
14.0
67.7
79.8
11.1
9.4
1.6
1.4
15.0
15.9
1.9
1.6
Maruti
Accumulate
9,631
10,619
290,918
79,470
95,208
15.9
17.2
281.7
363.8
34.2
26.5
7.4
6.0
21.7
22.8
3.3
2.7
Minda Industries
Neutral
1,294
-
11,178
4,328
5,084
11.0
11.9
27.3
36.4
47.5
35.5
10.1
7.9
23.1
25.6
2.7
2.3
Motherson Sumi
Neutral
372
-
78,239
55,937
64,445
10.8
11.4
16.9
21.1
22.0
17.7
4.9
5.0
25.2
25.4
1.5
1.2
Tata Motors
Neutral
418
-
120,807
303,167
343,649
11.8
13.8
33.1
54.7
12.6
7.7
2.1
1.7
16.9
23.0
0.5
0.4
TVS Motor
Neutral
763
-
36,252
13,992
16,216
9.0
9.4
17.1
20.3
44.8
37.6
11.9
9.2
29.7
27.7
2.5
2.1
Amara Raja Batteries
Neutral
846
-
14,453
6,140
7,122
14.3
15.6
29.3
39.0
28.9
21.7
4.9
4.1
17.1
19.0
2.4
2.0
Exide Industries
Neutral
219
-
18,590
8,689
9,854
15.1
15.2
9.7
11.0
22.7
19.9
4.0
3.5
15.7
16.1
1.9
1.6
Apollo Tyres
Neutral
269
-
15,362
15,739
17,326
13.3
14.6
20.4
26.7
13.2
10.1
1.6
1.4
20.4
26.7
1.2
1.1
Ceat
Neutral
1,949
-
7,882
6,661
7,717
11.1
14.2
116.2
178.2
16.8
10.9
2.9
2.4
15.2
21.3
1.3
1.1
JK Tyres
Neutral
148
-
3,347
8,318
9,239
16.2
16.4
21.0
27.5
7.0
5.4
1.4
1.1
19.1
20.4
0.9
0.7
Swaraj Engines
Neutral
2,025
-
2,515
788
889
16.4
16.5
71.6
81.0
28.3
25.0
8.2
7.6
29.6
31.0
2.9
2.5
Subros
Neutral
305
-
1,831
1,855
2,135
11.6
11.8
10.3
14.7
29.8
20.8
4.5
3.9
15.8
19.1
1.2
1.0
Capital Goods
BEML
Neutral
1,588
-
6,614
4,286
5,194
7.1
8.2
42.9
58.1
37.0
27.3
3.0
2.8
7.6
8.7
1.6
1.3
Bharat Electronics
Neutral
182
-
44,607
10,258
12,470
19.6
19.5
7.3
8.6
24.9
21.1
0.5
0.4
20.4
21.9
3.8
3.1
Voltas
Neutral
655
-
21,680
6,778
8,004
9.6
11.0
17.1
22.4
38.3
29.3
9.1
8.0
17.7
19.8
2.9
2.4
BHEL
Neutral
92
-
33,850
33,200
39,167
6.8
9.5
6.2
11.2
14.9
8.2
0.7
0.7
4.6
8.0
0.6
0.5
Blue Star
Accumulate
814
867
7,807
5,220
6,207
6.3
6.6
16.8
22.3
48.5
36.5
9.6
8.5
19.9
23.3
1.5
1.2
CG Power and Industrial
Neutral
93
-
5,801
6,555
7,292
7.5
7.5
-
0.8
9,255.0
115.7
1.4
1.4
0.1
1.2
1.0
0.9
Solutions
Greaves Cotton
Neutral
137
-
3,335
1,778
1,993
14.7
15.1
8.1
9.1
16.9
15.0
3.8
3.5
21.8
23.6
1.6
1.5
Stock Watch
December 29, 2017
Company Name
Reco
CMP
Target
Mkt Cap
Sales ( Čcr )
OPM(%)
EPS (Č)
PER(x)
P/BV(x)
RoE(%)
EV/Sales(x)
(Č)
Price ( Č)
( Č cr )
FY18E FY19E
FY18E
FY19E
FY18E
FY19E
FY18E
FY19E
FY18E
FY19E
FY18E
FY19E
FY18E
FY19E
Capital Goods
KEC International
Neutral
369
-
9,483
9,779
11,113
9.4
9.8
14.2
18.2
26.0
20.3
5.0
4.1
21.1
22.1
1.2
1.1
KEI Industries
Buy
362
436
2,838
3,001
3,391
10.0
10.0
13.0
16.1
27.8
22.5
5.1
4.2
18.2
18.7
1.1
1.0
Thermax
Neutral
1,194
-
14,222
4,125
4,747
10.3
10.8
26.7
31.5
44.7
37.9
5.0
4.6
11.2
12.0
3.2
2.8
VATech Wabag
Accumulate
621
681
3,392
3,867
4,126
9.6
10.0
34.9
39.8
17.8
15.6
2.9
2.5
17.7
17.5
0.9
0.8
Cement
ACC
Neutral
1,745
-
32,775
12,255
13,350
13.5
14.3
58.0
66.2
30.1
26.4
3.6
3.3
11.5
12.2
2.7
2.4
Ambuja Cements
Neutral
271
-
53,821
10,250
11,450
17.5
19.0
7.2
8.3
37.7
32.7
2.7
2.6
7.0
7.8
5.0
4.4
India Cements
Neutral
180
-
5,542
6,135
6,750
14.8
15.2
8.5
11.5
21.2
15.6
1.1
1.0
4.8
6.2
1.2
1.1
JK Cement
Neutral
1,104
-
7,717
4,150
4,775
19.2
20.0
49.0
63.5
22.5
17.4
3.6
3.1
17.0
18.5
2.3
2.0
J K Lakshmi Cement
Neutral
431
-
5,076
3,422
3,757
15.5
17.0
13.5
23.2
32.0
18.6
3.3
2.9
10.8
15.5
1.9
1.6
Orient Cement
Neutral
169
-
3,461
2,215
3,233
16.8
17.0
5.9
6.9
28.6
24.5
2.2
2.0
10.8
10.1
2.6
1.7
Prism Cement
Buy
114
131
5,716
5,155
5,616
7.0
7.0
2.0
3.0
56.8
37.9
5.2
4.5
10.0
13.8
1.4
1.3
UltraTech Cement
Neutral
4,276
-
117,403
28,250
35,150
20.2
23.5
77.5
122.2
55.2
35.0
4.7
4.2
9.6
14.8
4.6
3.7
Construction
KNR Constructions
Neutral
326
-
4,578
1,846
2,203
14.5
14.5
12.1
13.7
26.9
23.9
1.5
1.3
17.5
16.7
2.5
2.1
Larsen & Toubro
Neutral
1,253
-
175,584
95,787
109,476
10.2
11.6
44.5
50.8
28.2
24.7
3.5
3.2
12.9
13.1
2.4
2.1
Gujarat Pipavav Port
Neutral
136
-
6,575
739
842
61.6
62.7
5.1
6.2
26.7
22.1
3.3
3.2
12.7
14.9
8.4
7.2
PNC Infratech
Neutral
208
-
5,328
2,040
2,935
13.0
13.0
6.4
9.0
32.5
23.1
0.8
0.8
9.7
12.2
2.6
1.9
Simplex Infra
Neutral
580
-
2,871
6,012
6,619
11.6
11.7
21.1
31.0
27.6
18.8
1.9
1.8
6.5
8.6
1.0
0.9
Sadbhav Engineering
Neutral
420
-
7,209
3,823
4,426
10.7
10.8
10.3
11.8
40.8
35.6
4.9
4.3
10.1
10.5
2.2
1.9
NBCC
Neutral
247
-
22,266
9,099
12,706
6.4
6.4
7.3
9.6
34.0
25.9
1.5
1.2
27.5
30.5
2.3
1.7
MEP Infra
Neutral
95
-
1,551
2,403
2,910
18.3
16.8
2.4
6.1
40.6
15.7
15.4
10.4
35.2
55.8
1.8
1.5
SIPL
Neutral
144
-
5,067
2,060
2,390
46.8
47.7
(5.8)
(3.1)
5.4
6.2
(14.2)
(2.3)
7.2
6.7
Engineers India
Neutral
199
-
13,413
1,795
2,611
21.1
22.4
5.9
8.1
33.7
24.6
2.4
2.3
12.9
16.1
5.9
3.9
Financials
Axis Bank
Accumulate
547
580
140,347
32,558
35,843
3.5
3.2
27.8
41.0
19.7
13.3
2.1
1.9
11.4
14.9
-
-
Bank of Baroda
Neutral
163
-
37,500
22,533
26,079
2.4
2.4
12.0
20.9
13.6
7.8
0.9
0.8
6.6
11.0
-
-
Canara Bank
Neutral
361
-
21,559
17,925
20,235
2.0
2.1
18.5
36.5
19.5
9.9
0.7
0.7
3.4
6.2
-
-
Can Fin Homes
Neutral
475
-
6,320
586
741
3.5
3.5
107.8
141.0
4.4
3.4
1.0
0.8
24.1
25.6
-
-
Cholamandalam Inv. &
Neutral
1,288
-
20,127
2,826
3,307
6.3
6.3
53.7
64.6
24.0
20.0
4.1
3.5
18.3
18.9
-
-
Fin. Co.
Dewan Housing Finance Buy
586
712
18,368
2,676
3,383
2.4
2.7
37.4
49.7
15.7
11.8
2.1
1.8
13.8
16.2
-
-
Equitas Holdings
Buy
149
235
5,050
1,125
1,380
9.6
9.8
1.5
6.0
99.1
24.8
2.3
2.1
2.4
8.2
-
-
Stock Watch
December 29, 2017
Company Name
Reco
CMP
Target
Mkt Cap
Sales ( Čcr )
OPM(%)
EPS (Č)
PER(x)
P/BV(x)
RoE(%)
EV/Sales(x)
(Č)
Price ( Č)
( Č cr )
FY18E FY19E
FY18E
FY19E
FY18E
FY19E
FY18E
FY19E
FY18E
FY19E
FY18E
FY19E
FY18E
FY19E
Financials
Federal Bank
Accumulate
109
125
21,452
4,896
5,930
2.8
3.1
5.4
7.6
20.3
14.4
1.7
1.6
8.5
11.0
-
-
GIC Housing
Buy
467
655
2,516
376
477
3.6
3.7
33.0
40.0
14.2
11.7
2.5
2.1
20.0
23.0
-
-
HDFC Bank
Neutral
1,875
-
485,558
55,236
63,253
4.5
4.4
68.9
82.4
27.2
22.7
4.7
3.9
18.7
18.5
-
-
ICICI Bank
Neutral
314
-
201,804
42,361
51,378
3.6
3.9
18.4
25.7
17.1
12.2
1.9
1.8
11.3
15.0
-
-
Karur Vysya Bank
Buy
124
180
8,916
3,289
3,630
3.7
3.9
10.8
14.1
11.4
8.8
1.4
1.2
12.5
14.7
-
-
LIC Housing Finance
Accumulate
562
630
28,344
4,895
6,332
3.4
3.7
50.7
66.8
11.1
8.4
2.2
1.8
21.7
23.8
-
-
Punjab Natl.Bank
Neutral
171
-
41,405
23,708
25,758
2.1
2.1
5.9
16.4
29.0
10.4
0.9
0.8
3.0
8.3
-
-
RBL Bank
Neutral
507
-
21,157
2,309
2,888
2.6
2.5
16.4
19.1
31.0
26.6
3.9
3.5
13.3
13.8
-
-
Repco Home Finance
Buy
681
825
4,261
496
597
4.4
4.2
38.5
48.7
17.7
14.0
3.2
2.6
19.6
20.6
-
-
South Ind.Bank
Neutral
31
-
5,589
3,195
3,567
3.0
3.1
3.0
3.8
10.3
8.1
1.0
0.9
10.5
11.9
-
-
St Bk of India
Neutral
308
-
266,126
105,827
121,056
2.4
2.5
16.1
25.6
19.2
12.1
1.5
1.4
6.6
9.9
-
-
Union Bank
Neutral
146
-
12,485
14,650
16,225
2.3
2.3
23.1
32.5
6.3
4.5
0.5
0.4
7.1
9.2
-
-
Yes Bank
Neutral
314
-
72,065
11,088
13,138
3.0
2.9
84.0
99.3
3.7
3.2
0.6
0.5
16.3
16.8
-
-
FMCG
Akzo Nobel India
Neutral
1,802
-
8,642
3,164
3,607
13.8
13.7
58.6
67.9
30.8
26.5
7.6
6.7
24.5
25.1
2.6
2.3
Asian Paints
Neutral
1,145
-
109,790
17,603
20,615
18.6
18.6
2,128.9
2,543.3
0.5
0.5
11.3
9.5
28.0
28.9
6.0
5.1
Britannia
Neutral
4,675
-
56,129
9,690
11,278
14.8
15.4
84.0
101.0
55.7
46.3
20.3
16.1
40.6
39.0
5.8
4.9
Colgate
Neutral
1,082
-
29,436
4,420
5,074
24.9
25.3
28.6
32.8
37.8
33.0
14.9
12.1
43.8
40.5
6.4
5.5
Dabur India
Neutral
346
-
60,966
8,346
9,344
19.6
19.9
7.8
9.0
44.4
38.5
8.9
8.1
25.2
24.8
6.9
6.1
GlaxoSmith Con*
Neutral
6,588
-
27,704
5,072
5,760
18.2
18.4
176.3
199.2
37.4
33.1
7.9
7.2
21.2
21.7
4.8
4.2
Godrej Consumer
Neutral
982
-
66,879
10,171
11,682
20.8
21.5
21.7
27.1
45.2
36.2
10.2
8.7
22.3
23.4
6.7
5.8
HUL
Neutral
1,357
-
293,796
37,077
41,508
20.3
21.8
5,189.9
6,318.5
0.3
0.2
41.4
35.4
74.8
82.0
7.8
6.9
ITC
Neutral
261
-
318,513
44,588
49,853
37.0
37.3
9.6
11.0
27.2
23.8
6.7
6.4
25.1
27.3
6.6
5.9
Marico
Neutral
317
-
40,924
6,788
7,766
18.5
19.2
7.1
8.5
44.7
37.3
15.6
13.4
36.9
38.0
5.9
5.1
Nestle*
Neutral
7,721
-
74,442
10,083
11,182
20.0
20.9
119.7
141.3
64.5
54.6
227.3
207.8
36.7
39.8
7.1
6.3
Tata Global
Neutral
307
-
19,350
7,121
7,641
11.9
12.3
6.9
8.0
44.4
38.3
3.0
2.8
6.8
7.2
2.5
2.3
Procter & Gamble
Neutral
9,409
-
30,542
3,034
3,579
27.1
27.7
167.7
198.8
56.1
47.3
15.1
13.0
28.8
29.5
9.5
8.0
Hygiene
IT
HCL Tech^
Buy
878
1,014
125,318
50,009
54,608
22.1
22.1
62.8
67.6
14.0
13.0
3.1
2.7
22.4
20.6
2.2
1.9
Infosys
Accumulate
1,034
1,120
237,509
70,333
75,960
26.0
26.0
61.7
65.9
16.8
15.7
3.2
2.9
18.9
18.7
2.8
2.5
TCS
Reduce
2,629
2,442
503,238
123,384
134,488
26.1
26.1
133.2
143.7
19.7
18.3
5.4
5.1
27.6
27.8
3.7
3.4
Stock Watch
December 29, 2017
Company Name
Reco
CMP
Target
Mkt Cap
Sales ( Čcr )
OPM(%)
EPS (Č)
PER(x)
P/BV(x)
RoE(%)
EV/Sales(x)
(Č)
Price ( Č)
( Č cr )
FY18E FY19E
FY18E
FY19E
FY18E
FY19E
FY18E
FY19E
FY18E
FY19E
FY18E
FY19E
FY18E
FY19E
IT
Tech Mahindra
Accumulate
498
526
48,703
30,545
32,988
15.0
15.0
35.2
37.6
14.2
13.3
2.4
2.2
16.8
16.2
1.4
1.2
Wipro
Neutral
308
-
149,675
54,164
56,544
22.3
22.3
18.8
19.5
16.4
15.8
2.6
2.3
15.0
13.6
2.0
1.8
Media
D B Corp
Neutral
355
-
6,534
2,404
2,625
30.5
31.5
23.7
26.9
15.0
13.2
3.5
3.0
23.5
22.8
2.6
2.3
HT Media
Neutral
98
-
2,286
2,589
2,830
15.1
15.4
8.3
10.9
11.8
9.0
1.0
0.9
8.4
10.4
0.4
0.3
Jagran Prakashan
Buy
178
225
5,531
2,541
2,835
28.5
28.7
12.7
14.1
14.0
12.6
2.9
2.5
21.3
21.4
2.0
1.7
Sun TV Network
Neutral
1,001
-
39,428
3,238
3,789
51.9
55.1
30.9
38.0
32.4
26.3
9.2
8.1
30.0
31.0
11.7
9.9
Hindustan Media
Neutral
251
-
1,839
1,002
1,074
23.3
23.5
29.2
33.8
8.6
7.4
1.3
1.1
15.6
15.4
0.8
0.6
Ventures
TV Today Network
Accumulate
435
500
2,596
667
727
27.7
27.7
18.6
20.1
23.4
21.7
3.6
3.7
15.6
17.3
3.4
3.2
Music Broadcast Limited Accumulate
385
434
2,197
271
317
91.0
109.0
6.0
10.0
64.2
38.5
4.0
3.6
6.5
9.3
7.7
6.3
Metals & Mining
Coal India
Neutral
263
-
163,224
82,301
91,235
17.0
18.0
17.1
20.5
15.4
12.8
2.9
2.7
45.0
55.0
1.7
1.5
Hind. Zinc
Neutral
311
-
131,386
22,108
24,555
57.0
58.0
22.1
26.3
14.1
11.8
4.6
3.7
32.0
35.0
4.9
4.1
Hindalco
Neutral
275
-
61,813
102,350
105,355
13.5
14.5
21.5
24.5
12.8
11.2
1.8
1.5
15.0
15.2
1.2
1.1
JSW Steel
Neutral
271
-
65,567
64,500
68,245
21.1
21.5
20.1
21.2
13.5
12.8
2.5
2.1
-
-
1.7
1.7
NMDC
Neutral
138
-
43,725
10,209
11,450
47.0
48.0
11.1
12.1
12.5
11.4
1.7
1.6
-
-
3.8
3.4
SAIL
Neutral
93
-
38,307
54,100
63,555
3.0
10.0
(10.0)
1.5
61.8
1.2
1.2
-
-
1.7
1.5
Vedanta
Neutral
333
-
123,671
81,206
87,345
28.0
29.0
26.5
33.5
12.6
9.9
2.9
2.5
-
-
2.3
2.0
Tata Steel
Neutral
735
-
71,350
121,445
126,500
16.2
17.2
65.4
81.3
11.2
9.0
1.8
1.5
-
-
1.1
1.0
Oil & Gas
GAIL
Neutral
511
-
86,375
53,115
52,344
14.2
15.3
30.0
31.1
17.0
16.4
2.1
2.0
-
-
1.4
1.3
ONGC
Neutral
193
-
247,682
83,111
84,934
44.2
44.9
16.4
16.9
11.8
11.4
1.4
1.3
-
-
2.9
2.8
Indian Oil Corp
Neutral
392
-
190,351
396,116
432,560
8.5
8.8
40.1
42.2
9.8
9.3
1.7
1.5
-
-
0.6
0.6
Reliance Industries
Neutral
924
-
601,211
257,711
267,438
17.0
18.2
89.1
89.5
10.4
10.3
1.0
0.9
-
-
2.0
1.9
Pharmaceuticals
Alembic Pharma
Accumulate
543
600
10,228
3,346
3,915
19.6
19.2
21.0
23.9
25.8
22.7
4.6
3.9
19.1
18.4
3.1
2.6
Alkem Laboratories Ltd
Accumulate
2,198
2,341
26,286
6,320
7,341
17.5
19.8
72.7
96.6
30.2
22.8
5.4
4.5
16.7
18.7
4.1
3.4
Aurobindo Pharma
Buy
685
823
40,112
17,086
19,478
22.1
22.0
44.7
51.4
15.3
13.3
3.4
2.7
24.7
22.7
2.5
2.1
Aventis*
Neutral
4,746
-
10,929
2,411
2,698
18.8
18.8
151.6
163.9
31.3
29.0
4.9
3.9
25.4
27.5
4.1
3.5
Cadila Healthcare
Neutral
425
-
43,499
11,365
12,926
20.0
20.0
18.4
20.5
23.1
20.7
5.1
4.2
24.3
22.2
3.9
3.4
Cipla
Sell
605
462
48,703
16,163
18,711
16.6
16.9
20.7
24.3
29.2
24.9
3.5
3.1
12.6
13.1
3.1
2.7
Dr Reddy's
Sell
2,432
2,040
40,324
13,734
15,548
17.7
20.2
69.9
102.0
34.8
23.8
3.1
2.8
9.2
12.4
3.2
2.8
GSK Pharma*
Sell
2,431
2,000
20,594
2,968
3,324
13.8
15.9
37.8
46.3
64.3
52.5
11.3
12.3
16.7
22.4
6.7
6.2
Stock Watch
December 29, 2017
Company Name
Reco
CMP
Target
Mkt Cap
Sales ( Čcr )
OPM(%)
EPS (Č)
PER(x)
P/BV(x)
RoE(%)
EV/Sales(x)
(Č)
Price ( Č)
( Č cr )
FY18E FY19E
FY18E
FY19E
FY18E
FY19E
FY18E
FY19E
FY18E
FY19E
FY18E
FY19E
FY18E
FY19E
Pharmaceuticals
Indoco Remedies
Sell
286
136
2,636
1,114
1,297
9.9
13.9
5.6
11.4
51.1
25.1
3.9
3.4
7.7
14.5
2.6
2.2
Ipca labs
Neutral
605
-
7,635
3,256
3,647
14.1
17.1
16.2
25.4
37.4
23.8
2.9
2.6
8.0
11.5
2.4
2.1
Lupin
Buy
881
1,091
39,817
16,240
18,562
21.3
21.7
42.5
49.6
20.7
17.8
2.6
2.3
13.3
13.7
2.6
2.2
Natco Pharma
Accumulate
957
1,057
17,662
1,886
2,016
32.3
29.5
23.2
22.0
41.4
43.4
8.7
7.7
20.9
17.6
9.2
8.6
Sun Pharma
Accumulate
568
630
136,253
28,312
32,153
20.7
23.1
18.5
23.3
30.7
24.4
3.5
3.1
11.5
14.6
4.4
3.8
Syngene International
Accumulate
545
587
10,907
1,394
1,818
33.0
36.5
15.8
21.0
34.5
26.0
6.4
5.3
18.6
20.3
7.8
6.0
Power
Tata Power
Neutral
92
-
24,897
32,547
33,806
20.5
20.5
4.7
5.4
19.6
17.2
1.9
1.6
10.5
10.5
1.8
1.7
NTPC
Neutral
176
-
144,914
86,070
101,246
28.3
30.7
12.9
16.2
13.6
10.9
1.4
1.3
10.6
12.4
3.0
2.7
Power Grid
Accumulate
199
223
104,109
29,183
32,946
89.7
90.0
18.0
20.8
11.1
9.6
1.9
1.6
17.7
18.2
7.5
7.0
Real Estate
Prestige Estate
Neutral
320
-
11,983
4,607
5,146
21.0
22.2
7.9
9.8
40.5
32.6
2.5
2.3
10.3
12.0
3.8
3.4
MLIFE
Accumulate
465
522
2,385
487
590
12.3
17.8
21.0
31.2
22.1
14.9
1.2
1.1
5.2
7.4
3.6
2.9
Telecom
Bharti Airtel
Neutral
531
-
212,282
97,903
105,233
36.0
36.3
9.3
11.1
57.1
48.1
2.8
2.6
5.0
5.6
3.1
2.8
Idea Cellular
Neutral
102
-
36,868
35,012
37,689
27.1
27.7
(4.4)
(2.7)
1.6
1.7
(6.8)
(4.6)
2.4
2.1
Others
Abbott India
Neutral
5,499
-
11,685
3,244
3,723
14.9
16.1
167.5
209.4
32.8
26.3
7.2
6.1
23.7
24.8
3.3
2.8
Asian Granito
Neutral
558
-
1,680
1,169
1,286
12.5
12.5
16.0
19.7
35.0
28.3
3.7
3.3
10.7
11.6
1.7
1.5
Bajaj Electricals
Neutral
493
-
5,025
4,646
5,301
6.7
7.6
16.1
22.3
30.6
22.1
5.0
4.3
16.4
19.2
1.1
0.9
Banco Products (India)
Neutral
258
-
1,845
1,530
1,695
13.2
12.7
19.0
20.0
13.6
12.9
2.2
1.9
0.2
0.2
1.1
124.9
Coffee Day Enterprises
Neutral
278
-
5,721
3,494
3,913
17.4
18.0
4.8
5.7
-
48.7
2.5
2.3
-
0.1
2.1
1.8
Ltd
Elecon Engineering
Neutral
104
-
1,167
171
201
15.0
16.2
36.0
43.0
2.9
2.4
0.2
0.2
0.1
0.1
6.2
5.3
Garware Wall Ropes
Neutral
955
-
2,090
928
1,003
15.2
15.2
39.4
43.2
24.2
22.1
4.0
3.4
16.5
15.4
2.1
1.9
Goodyear India*
Neutral
1,001
-
2,309
1,717
1,866
11.8
12.3
47.9
49.8
20.9
20.1
3.2
2.8
15.6
15.7
1.1
149.4
Hitachi
Neutral
2,634
-
7,163
2,355
2,715
10.3
10.8
49.0
60.9
53.8
43.3
12.6
10.0
0.2
0.2
3.1
2.6
HSIL
Neutral
504
-
3,642
2,240
2,670
14.6
15.0
17.0
22.0
29.6
22.9
2.4
2.3
0.1
0.1
1.8
1.5
Interglobe Aviation
Neutral
1,208
-
46,406
22,570
27,955
14.2
15.0
63.6
81.8
19.0
14.8
10.0
8.4
0.5
0.6
1.7
1.3
Jyothy Laboratories
Neutral
380
-
6,913
1,781
2,044
14.1
15.0
9.4
10.5
40.7
36.2
8.7
8.1
0.2
0.2
4.1
3.5
Linc Pen & Plastics
Neutral
337
-
498
420
462
9.3
9.3
15.3
17.1
22.0
19.7
3.7
3.8
16.9
19.5
1.2
1.1
M M Forgings
Neutral
1,195
-
1,442
542
642
20.1
21.0
41.6
56.8
28.7
21.0
4.0
3.4
0.1
0.2
3.1
2.7
Mirza International
Neutral
160
-
1,924
1,148
1,285
18.0
18.0
8.0
9.4
19.9
17.1
3.3
2.8
16.3
16.1
1.8
1.6
Navkar Corporation
Buy
190
265
2,860
561
617
41.5
41.5
11.5
12.7
16.5
15.0
1.7
1.6
10.5
10.4
5.8
5.0
Stock Watch
December 29, 2017
Company Name
Reco
CMP
Target Mkt Cap
Sales ( Čcr )
OPM(%)
EPS (Č)
PER(x)
P/BV(x)
RoE(%)
EV/Sales(x)
(Č)
Price ( Č)
( Č cr )
FY18E FY19E FY18E FY19E FY18E FY19E
FY18E FY19E
FY18E FY19E
FY18E FY19E
FY18E FY19E
Others
Nilkamal
Neutral
1,824
-
2,723
2,317
2,525
11.4
11.1
96.0
105.0
19.0
17.4
3.2
2.8
0.2
0.2
1.2
1.0
Parag Milk Foods
Neutral
290
-
2,441
1,987
2,379
7.6
9.0
12.4
18.3
23.4
15.9
3.3
2.9
8.2
13.2
1.3
1.1
Radico Khaitan
Neutral
288
-
3,834
1,811
1,992
13.2
13.2
8.1
8.8
35.5
32.7
3.6
3.9
10.1
12.0
2.4
2.2
Relaxo Footwears
Neutral
682
-
8,203
1,981
2,310
13.7
14.5
12.0
15.5
56.8
44.0
11.1
9.0
0.2
0.2
4.2
3.6
Siyaram Silk Mills
Accumulate
756
813
3,542
1,769
1,981
12.7
12.7
22.6
26.2
33.4
28.8
5.2
4.5
15.5
15.5
2.2
1.9
Styrolution ABS India* Neutral
1,059
-
1,862
1,800
1,980
8.0
8.1
42.0
46.2
25.2
22.9
2.8
2.5
0.1
0.1
1.2
1.1
Surya Roshni
Neutral
395
-
1,731
4,870
5,320
7.7
7.8
22.8
28.1
17.4
14.1
2.3
2.0
0.1
0.1
0.6
0.5
TVS Srichakra
Neutral
3,790
-
2,902
2,729
2,893
12.7
12.5
248.5
265.0
15.3
14.3
4.3
3.5
0.3
0.3
1.1
1.0
Visaka Industries
Neutral
636
-
1,010
1,104
1,214
12.1
12.6
31.0
37.9
20.5
16.8
2.5
2.2
0.1
0.1
1.1
1.0
VIP Industries
Buy
347
400
4,909
1,450
1,693
10.4
10.5
6.5
7.8
53.1
44.5
11.2
9.8
21.1
22.1
3.4
2.9
Navin Fluorine
Neutral
822
-
4,055
945
1,154
17.5
17.9
28.7
34.8
28.7
23.6
4.7
4.1
-
-
3.8
3.0
Century Plyboards India Buy
338
400
7,502
2,007
2,510
22.4
22.6
8.4
11.1
40.2
30.4
8.5
6.9
21.3
22.9
4.1
3.3
LT Foods
Accumulate
89
96
2,850
3,287
3,747
11.1
11.5
4.4
5.2
20.2
17.1
3.0
2.5
17.5
17.6
1.4
1.2
Ruchira Papers
Buy
198
244
444
470
532
15.6
15.6
16.5
19.0
12.0
10.4
2.4
2.0
20.0
19.2
1.1
1.0
Source: Company, Angel Research; Note: *December year end; #September year end; &October year end; Price as on December 28, 2017
Market Outlook
December 29, 2017
Research Team Tel: 022 - 39357800
DISCLAIMER
Angel Broking Private Limited (hereinafter referred to as “Angel”) is a registered Member of National Stock Exchange of India
Limited,Bombay Stock Exchange Limited and Metropolitan Stock Exchange Limited. It is also registered as a Depository Participant with
CDSL and Portfolio Manager with SEBI. It also has registration with AMFI as a Mutual Fund Distributor. Angel Broking Private Limited is a
registered entity with SEBI for Research Analyst in terms of SEBI (Research Analyst) Regulations, 2014 vide registration number
INH000000164. Angel or its associates has not been debarred/ suspended by SEBI or any other regulatory authority for accessing
/dealing in securities Market. Angel or its associates/analyst has not received any compensation / managed or
co-managed public offering of securities of the company covered by Analyst during the past twelve months.
This document is solely for the personal information of the recipient, and must not be singularly used as the basis of any investment
decision. Nothing in this document should be construed as investment or financial advice. Each recipient of this document should make
such investigations as they deem necessary to arrive at an independent evaluation of an investment in the securities of the companies
referred to in this document (including the merits and risks involved), and should consult their own advisors to determine the merits and
risks of such an investment.
Reports based on technical and derivative analysis center on studying charts of a stock's price movement, outstanding positions and
trading volume, as opposed to focusing on a company's fundamentals and, as such, may not match with a report on a company's
fundamentals. Investors are advised to refer the Fundamental and Technical Research Reports available on our website to evaluate the
contrary view, if any.
The information in this document has been printed on the basis of publicly available information, internal data and other reliable
sources believed to be true, but we do not represent that it is accurate or complete and it should not be relied on as such, as this
document is for general guidance only. Angel Broking Pvt. Limited or any of its affiliates/ group companies shall not be in any way
responsible for any loss or damage that may arise to any person from any inadvertent error in the information contained in this report.
Angel Broking Pvt. Limited has not independently verified all the information contained within this document. Accordingly, we cannot
testify, nor make any representation or warranty, express or implied, to the accuracy, contents or data contained within this document.
While Angel Broking Pvt. Limited endeavors to update on a reasonable basis the information discussed in this material, there may be
regulatory, compliance, or other reasons that prevent us from doing so.
This document is being supplied to you solely for your information, and its contents, information or data may not be reproduced,
redistributed or passed on, directly or indirectly.
Neither Angel Broking Pvt. Limited, nor its directors, employees or affiliates shall be liable for any loss or damage that may arise from
or in connection with the use of this information.